The problem
You're flying blind
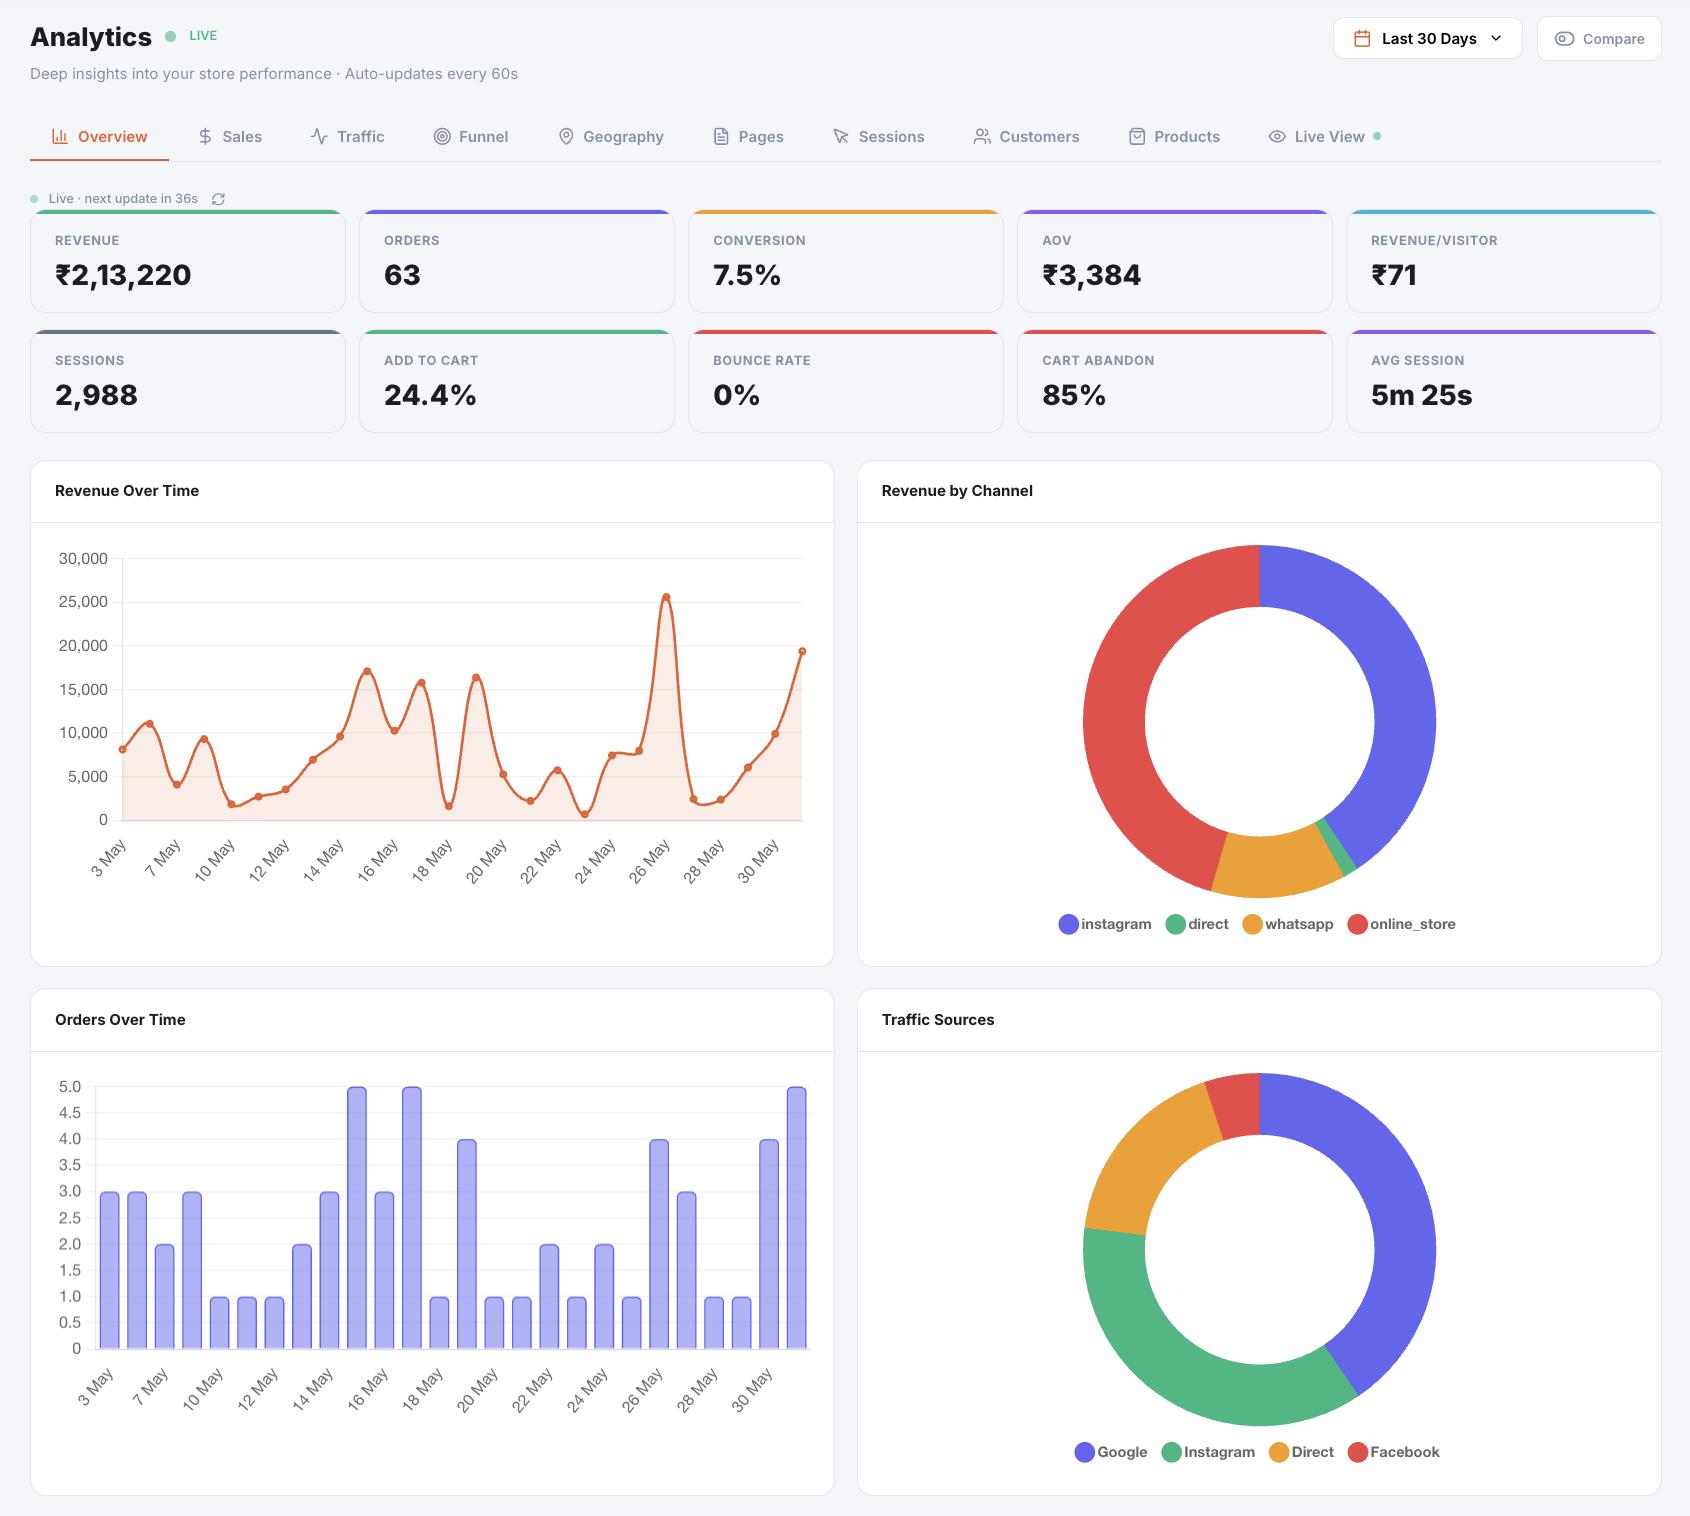
Scattered data across Google Analytics, Shopify reports, and spreadsheets. You spend more time stitching numbers together than actually reading them. PeakCart puts it all in one place — nine clear views, zero tab-switching.
At a glance
Watch your numbers come alive
Every metric, every trend — visualised the moment you open your dashboard.
How it works
Four lenses, one dashboard
Each view answers a different question about your business.
Sales trends
Daily, weekly, or monthly — compare any period against the last. Spot whether you're growing or coasting before month-end surprises.
Product performance
Best sellers, slow movers, and margin per product — all ranked. Know what to push and what to cut, without exporting a single CSV.
Traffic & channels
See exactly where your visitors come from — Instagram, Google, WhatsApp — and which channel actually converts into orders.
Geography
State and city breakdown shows you where demand is hottest and where delivery success rates need attention. Plan logistics with data, not assumptions.
Why it matters
Data you can actually act on
Decisions, not guesswork
Stop relying on gut feel. Every pricing change, ad spend, and inventory call is backed by real numbers from your own store.
Spot trends early
A dip in conversions, a spike in a city — PeakCart surfaces these patterns before they snowball into real problems.
Know your real winners
Revenue is one thing, margin is another. See which products actually make money after returns, discounts, and shipping costs.
Integrations
Works with the tools you already use
PeakCart pulls data from your payment gateway, shipping partner, and analytics — automatically.
Try it with your own products.
Free trial — no credit card, your real catalogue, your real numbers.
No credit card required · Setup in an afternoon